Data Flow Diagram (DFD)

11.2.1.6  use data flow diagrams (DFD) to input, process, store, and output data in computing systems

Data Flow Diagram (DFD)

Data Flow Diagrams (DFDs) are graphical tools used in the analysis and design of information systems.

A data flow diagram (DFD) illustrates how data is processed by a system in terms of inputs and outputs. As its name indicates its focus is on the flow of information, where data comes from, where it goes, and how it gets stored.


DFD Symbols 

There are four basic symbols that are used to represent a data-flow diagram.

External Entity

An external entity is a person, department, outside organization, or other information system that provides data to the system or receives outputs from the system. 

They either supply data or receive data
They do not process data


Notation 

A rectangle represents an external entity
External entities also are called terminators because they are data origins or final destinations.
An external entity must be connected to a process through a data flow.

Examples:

  • End User (Customer, Client, Admin, Supplier)
  • Purchasing Department
  • Inventory System

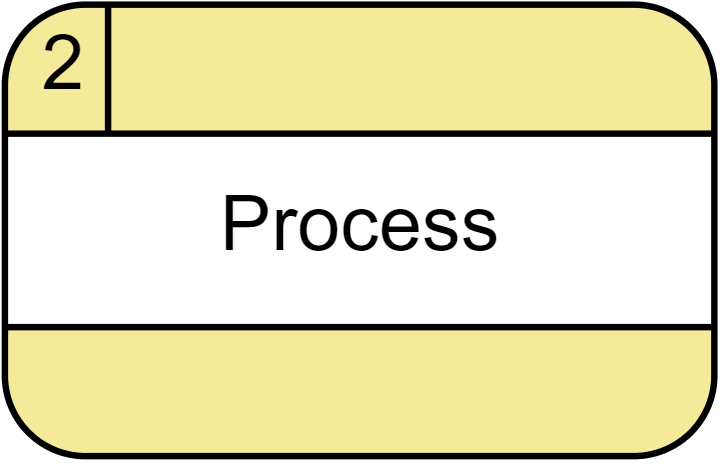
Process

A process receives input data, processes it, and produces output with a different content or form.

Every process has a name that identifies the function it performs. The name consists of a verb, followed by a singular noun.

Notation

A rounded rectangle represents a process
Processes are given IDs for easy referencing

Examples:

  • Apply for Payment
  • Calculate Commission
  • Create member account

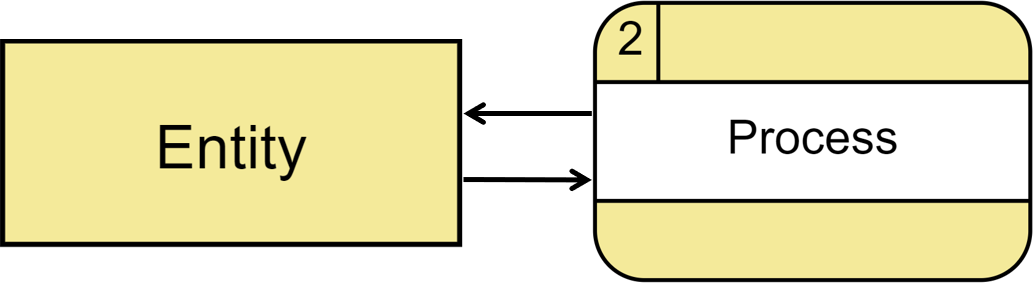
Data Flow

Data flow is the inputs and outputs of processes. 

A data flow may represent a single data element such as the Customer ID or it can represent a set of data elements (or a data structure).

Notation

Straight lines with incoming arrows are input data flow
Straight lines with outgoing arrows are output data flows

Examples:

  • Customer_info (CustomerID, LastName, FirstName, PhoneNumber, IIN, etc.);
  • Product_info(ProductID, ProductName, ProductPrice, etc);
  • Order_info (OrderID, Item, OrderDate, CustomerID, etc.).

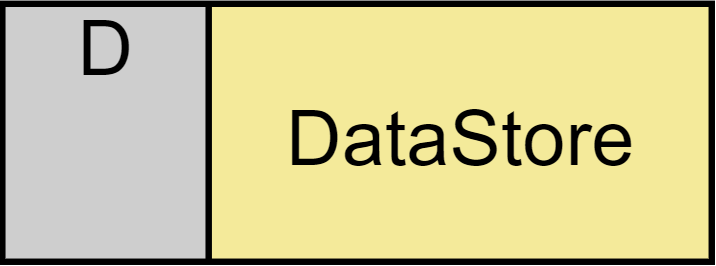
Data Store

A data store is used in a data-flow diagram to represent a situation when the system must retain data because one or more processes need to use the stored data at a later time.

  • A data store must be connected to a process with a data flow.
  • Each data store must have at least one input data flow and at least one output data flow (even if the output data flow is a control or confirmation message).

Notation

Data can be written into the data store, which is depicted by an outgoing arrow
Data can be read from a data store, which is depicted by an incoming arrow.

Examples:

  • Clients,
  • Inventory,
  • Accounts receivables,
  • Orders,
  • Daily Payments,
  • Sensors that generate data and send it to the system

DFD has often been used for the following reasons:

  • Logical information flow of the system
  • Determination of physical system construction requirements
  • Simplicity of notation
  • Establishment of manual and automated systems requirements

Mistakes in DFD

  • Black holes - A processing step may have input flows but no output flows.
  • Miracles - A processing step may have output flows but no input flows.
  • Grey holes - A processing step may have outputs that are greater than the sum of its inputs

Other logical mistakes:

Wrong Right Description
DFD wrong example 1 DFD right example 1 An entity cannot provide data to another entity without some processing occurring.
DFD wrong example 2 DFD right example 2 Data cannot move directly from an entity to a data story without being processed.
DFD wrong example 3 DFD right example 3 Data cannot move directly from a data store without being processed.
DFD wrong example 4 DFD right example 4 Data cannot move directly from one data store to another without being processed.
Two data flows can not cross each other.


More details in the source www.visual-paradigm.com

Rules for Data Flow Diagram


Advantages of DFD

  • It helps us to understand the functioning and the limits of a system.
  • It is a graphical representation that is very easy to understand as it helps visualize contents.
  • Data Flow Diagram represents a detailed and well-explained diagram of system components.
  • It is used as the part of system documentation file.
  • Data Flow Diagrams can be understood by both technical and nontechnical people because they are very easy to understand.

Disadvantages of DFD
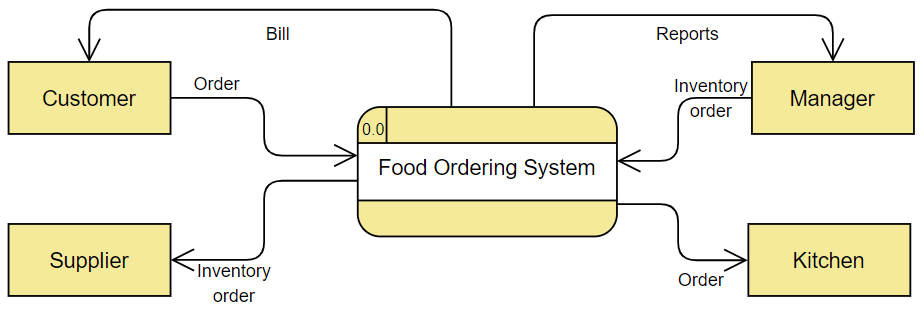
  • At times DFD can confuse the programmers regarding the system.
  • Data Flow Diagram takes a long time to be generated, and many times due to these reasons analysts are denied permission to work on it.

Source: www.geeksforgeeks.org

DFD request: Amazon


Levels of DFD

Level 0

It is also known as a context diagram. It’s designed to be an abstract view, showing the system as a single process with its relationship to external entities.

  • The context diagram must fit on one page.
  • The process name in the context diagram should be the name of the information system.
    • For example, the Grading System, Order Processing System, and Registration System.

Examples 1 - Food Ordering System


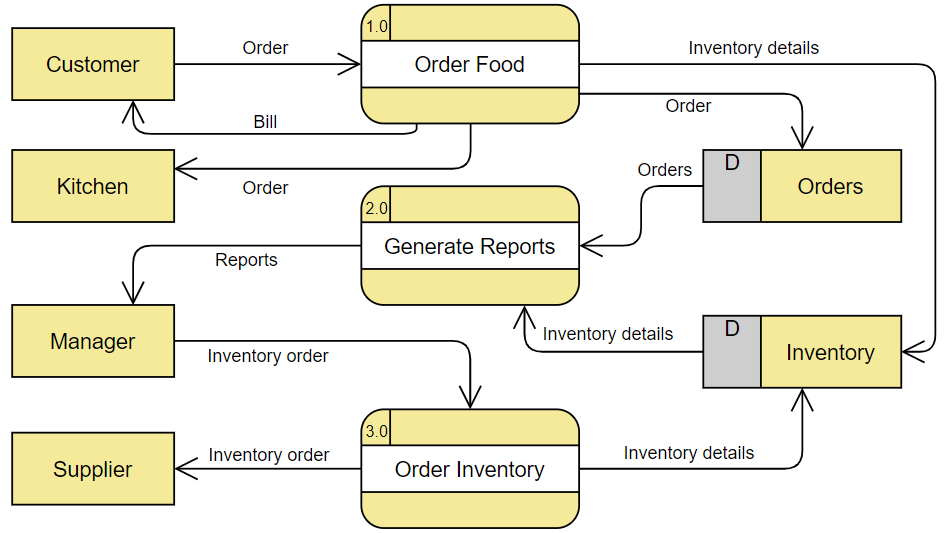
Level 1

In 1-level DFD, the context diagram is decomposed into multiple processes. In this level, we highlight the main functions of the system and break down the high-level process of 0-level DFD into subprocesses further to represent details of the processing activities.

Examples 1 - Food Ordering System


Level 2

If a process with a lot of data flow linking between a few external entities, we could first extract that particular process and the associated external entities into a separate diagram similar to a context diagram, before refining the process into a separate level of DFD; and by this way you can ensure the consistency between them much easier.

Example 2 - Customer Service System


Questions:

Ex. 1 (Author: Litvinova Olga - CS teacher of NIS Pavlodar)


Exercises:

Ex. 2

Ex. 3 Distribute correct and incorrect DFD fragments.

Ex. 4 (Author: Litvinova Olga - CS teacher of NIS Pavlodar)


Exam questions:


Категория: Flowcharts | Добавил: bzfar77 (01.10.2020)
Просмотров: 12819 | Теги: dfd, Level, Flows, context level, data storage, ENTiTY, data flow digram, Process | Рейтинг: 5.0/4
Всего комментариев: 0
avatar